In Artinis NIRS blog, you will find the latest trends in (f)NIRS, NIRS studies and applications, tutor from the leaders of near infrared spectroscopy, not to mention detailed insights and tips and tricks for your research!
Search blog post topic
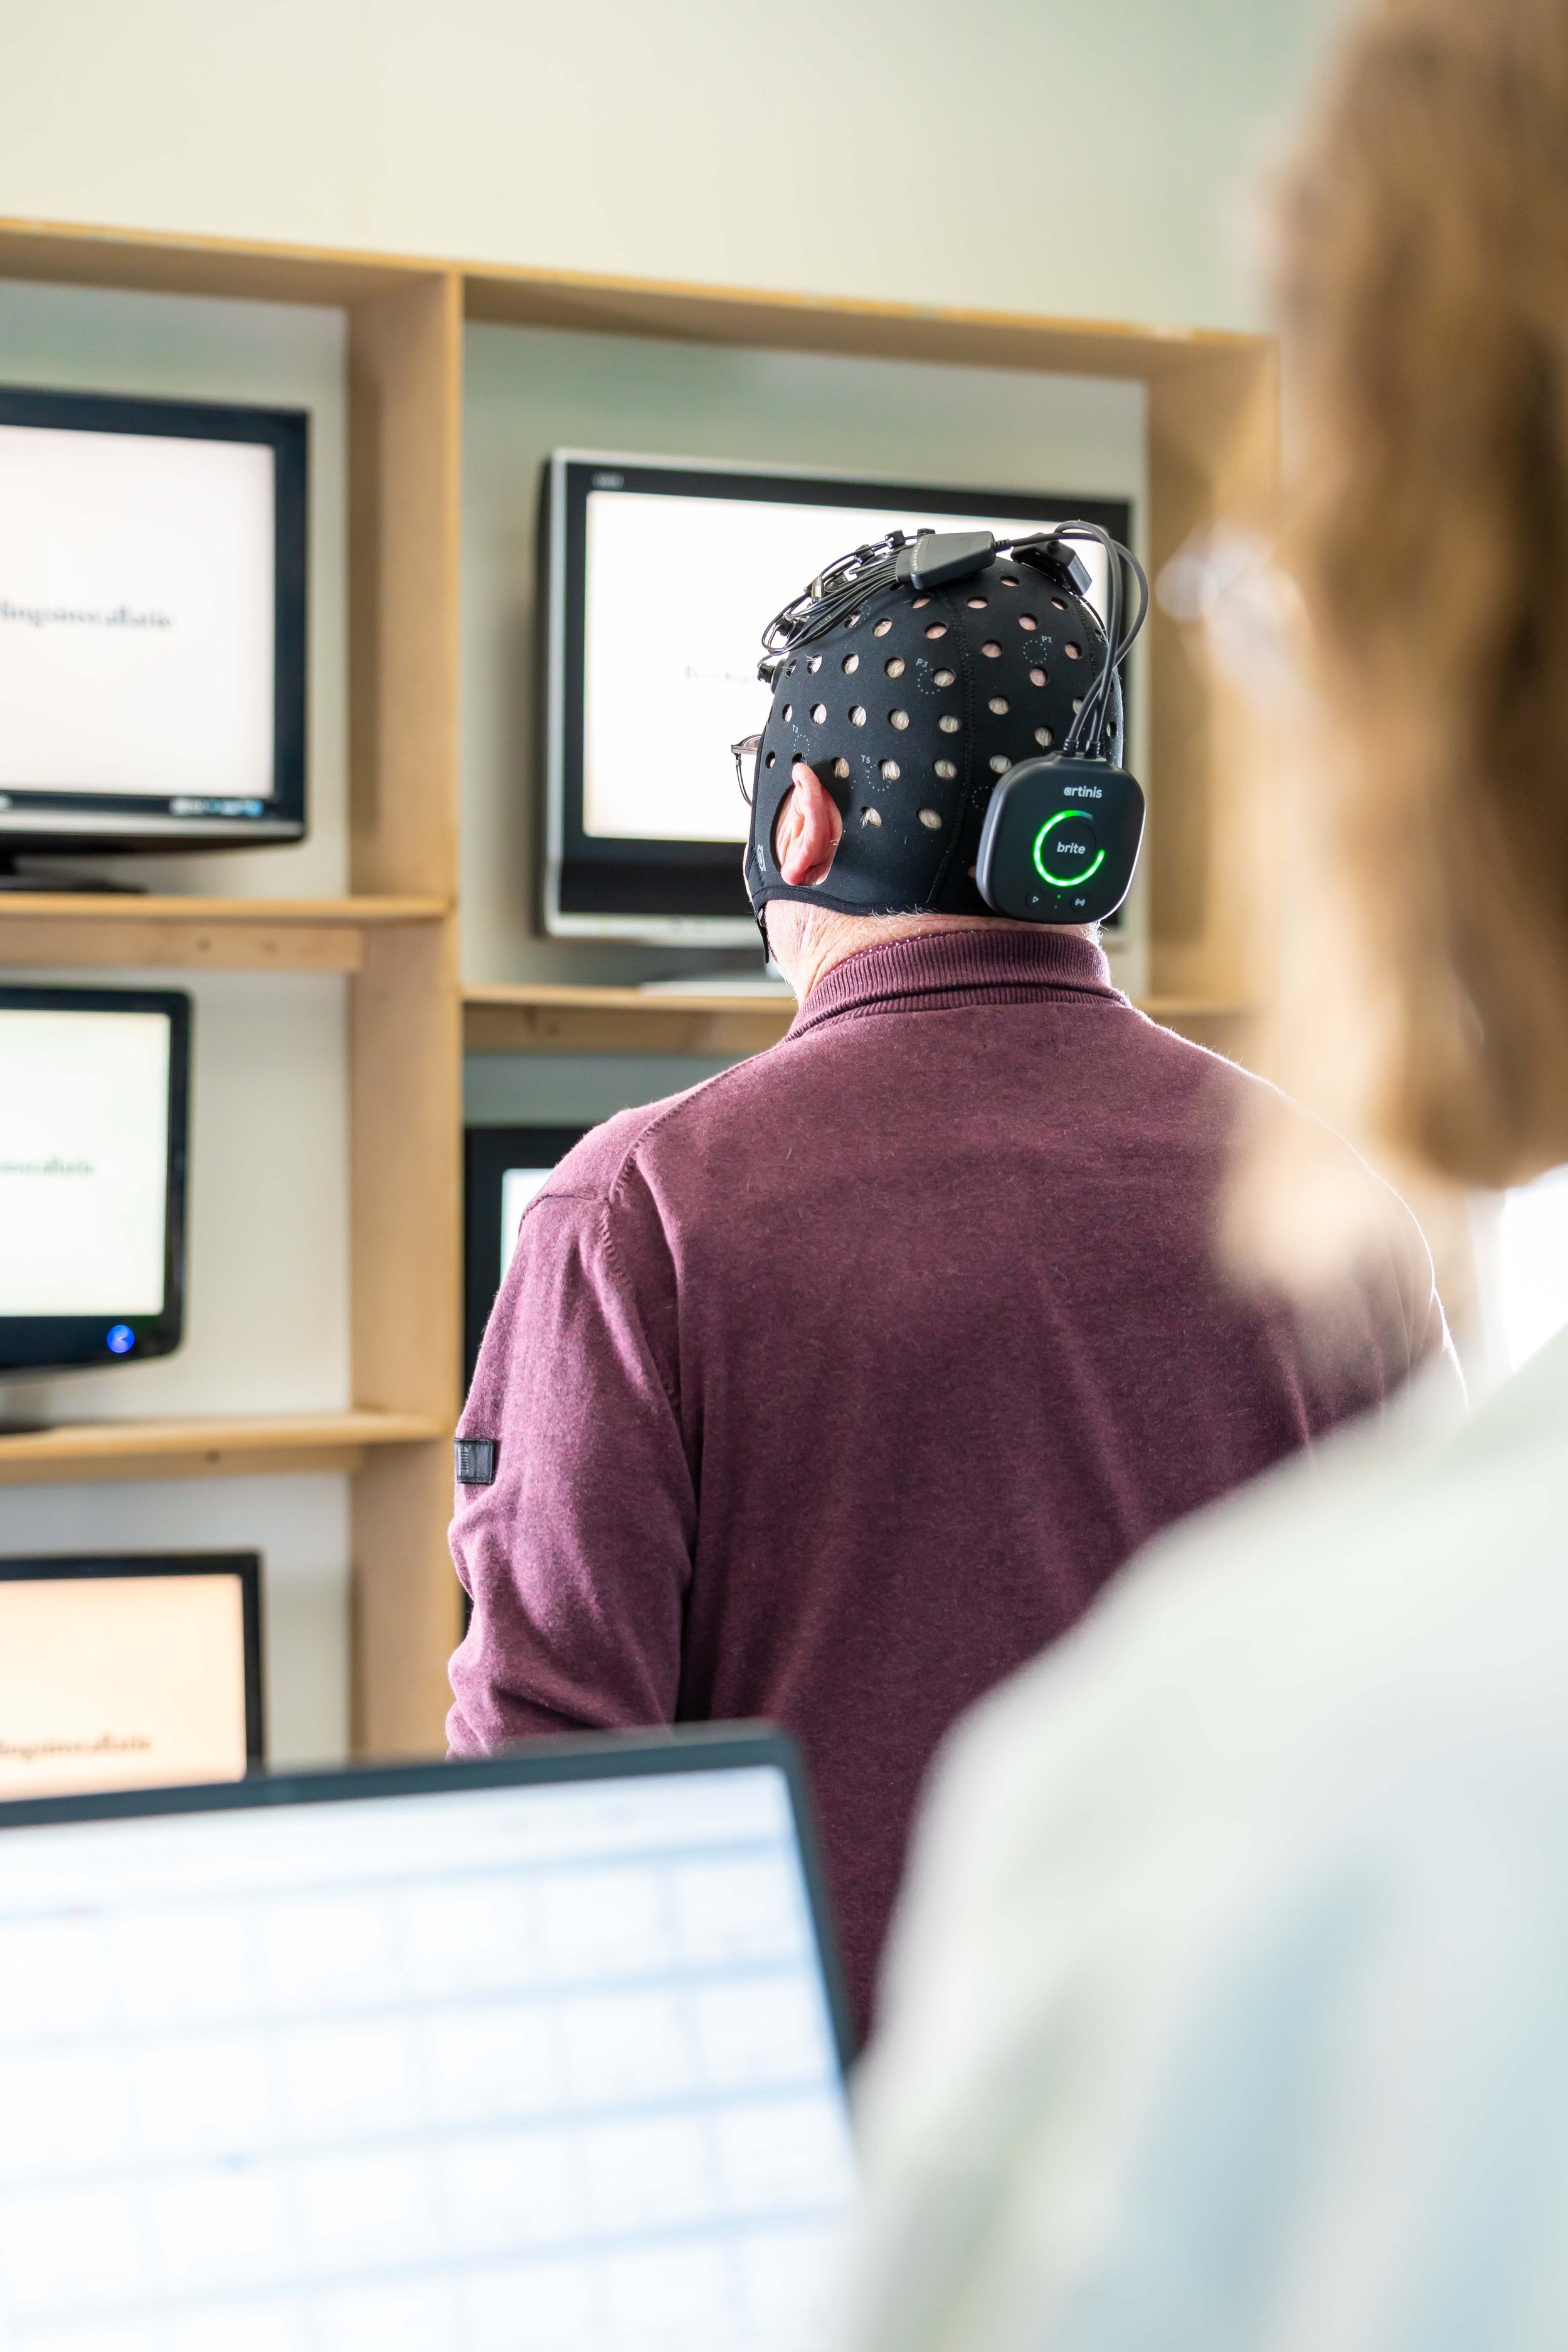
Which experimental designs to use in fNIRS — Introduction
This is the introduction post of our blogpost series on experimental designs in fNIRS. In this blogpost, we explain what fNIRS measures, which general considerations have to be considered, and which frequent experimental setups we have for fNIRS.
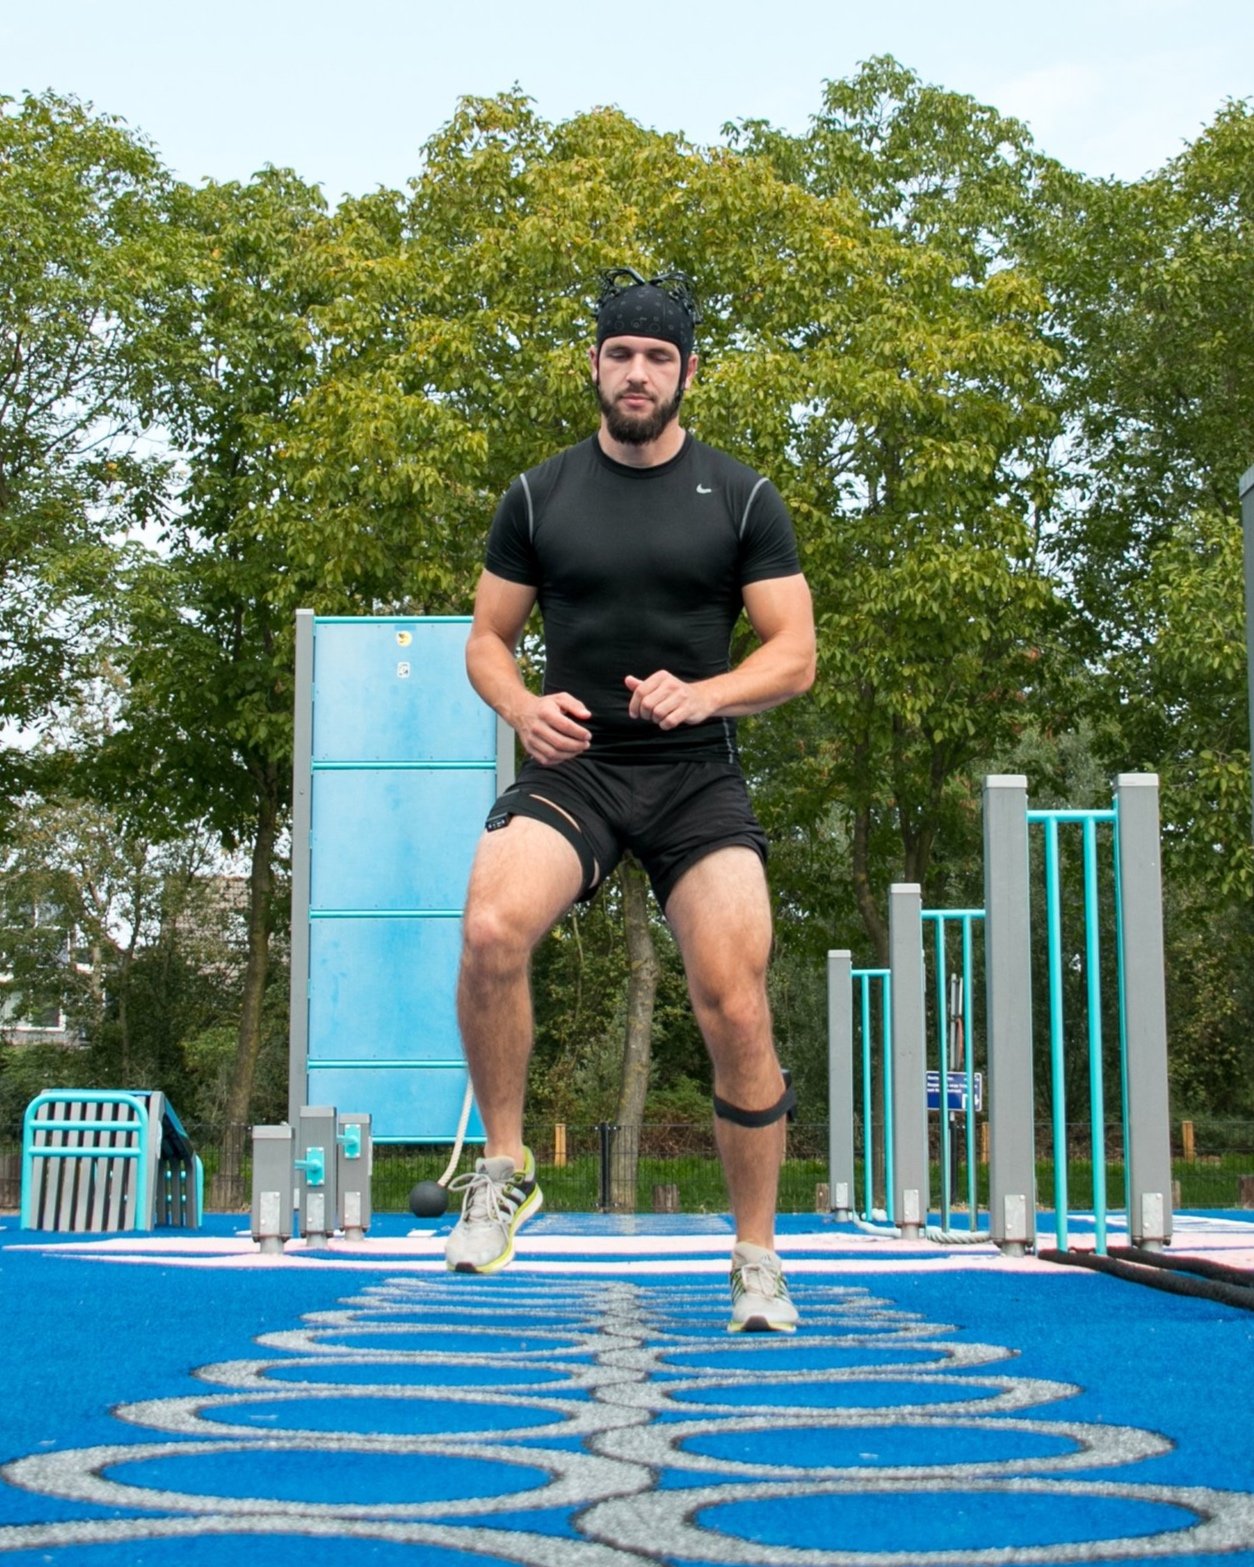
Beyond the Brain: Unveiling the Mind-Muscle Connection with Simultaneous NIRS
NIRS can be applied on any tissue enabling to measure brain and muscle oxygenation simultaneously. Read this blogpost to learn more about application areas employing NIRS on muscle and brain at the same time, recently published literature and solutions Artinis offers to make this possible.
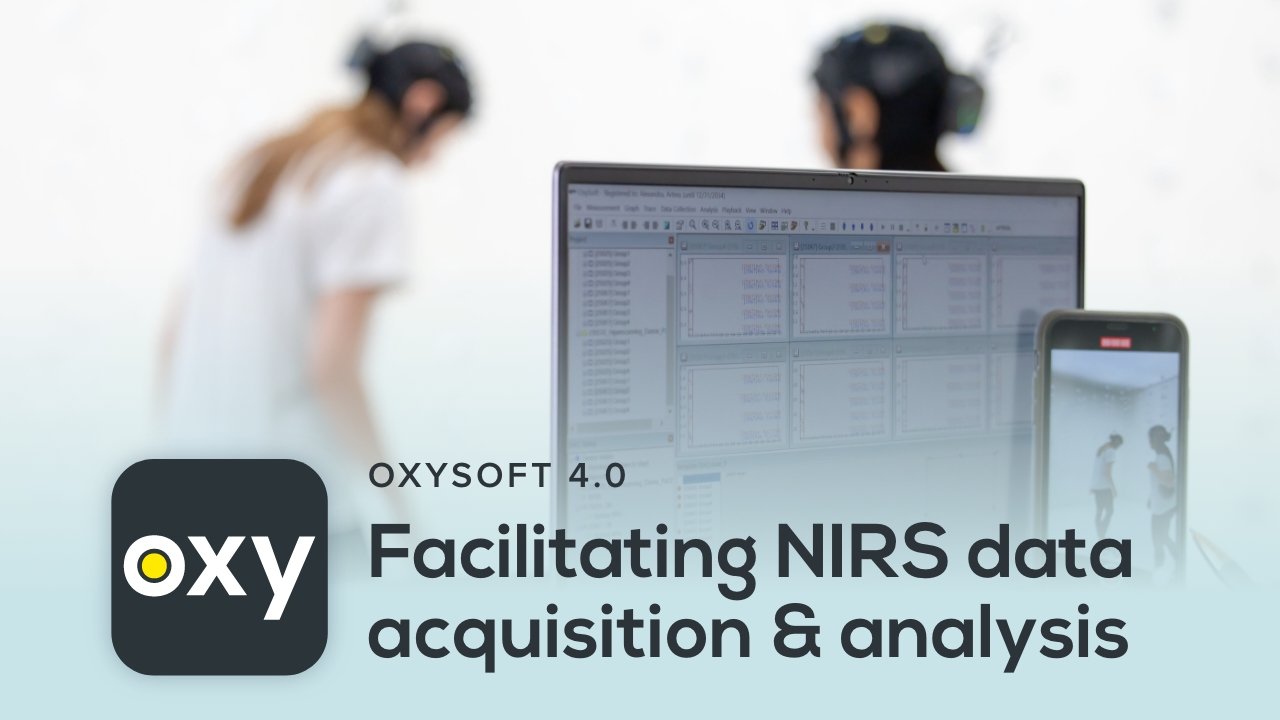
OxySoft 4.0 – Facilitating NIRS data acquisition and analysis
We are proud of the enhanced performance of our recently released NIRS monitoring software. In this blogpost, we list all exciting features included in OxySoft 4.0 and shortly explain, how they can be used.
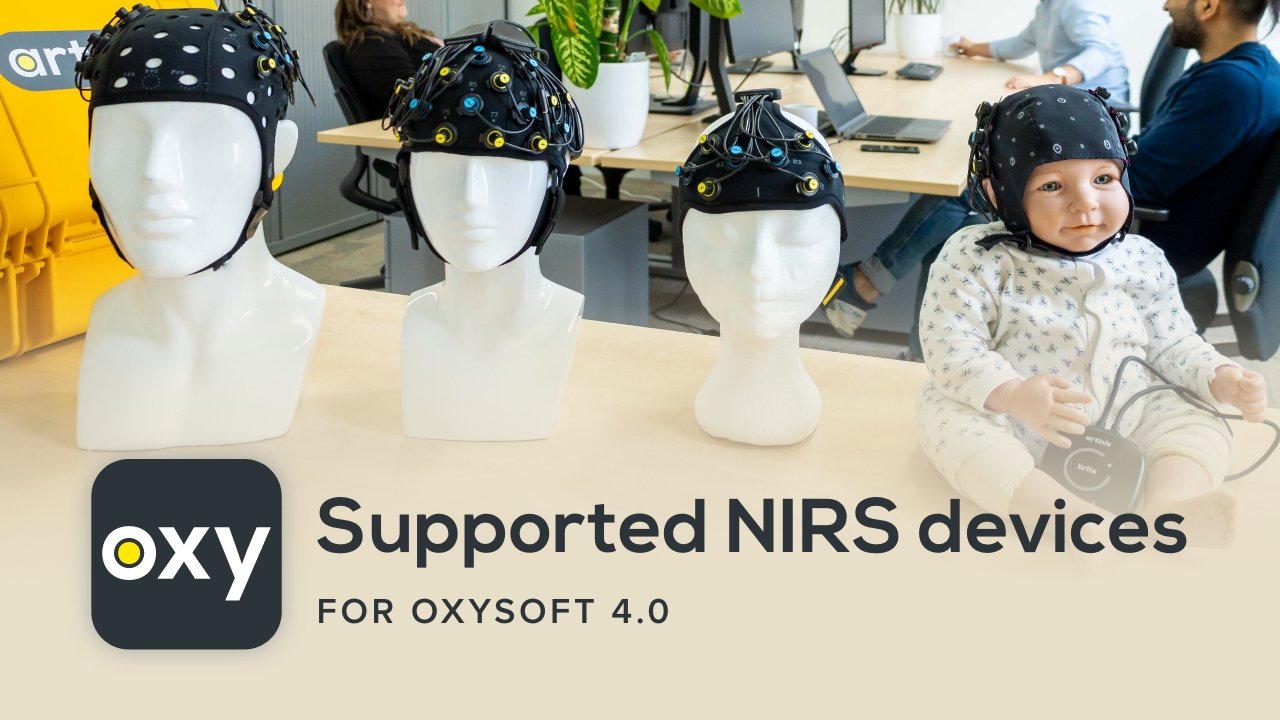
Supported NIRS devices for our elevated OxySoft 4.0
We are proud of the enhanced performance of our recently released NIRS monitoring software. In this blog post, we explain, which of our devices are supported in OxySoft 4.0 and higher.
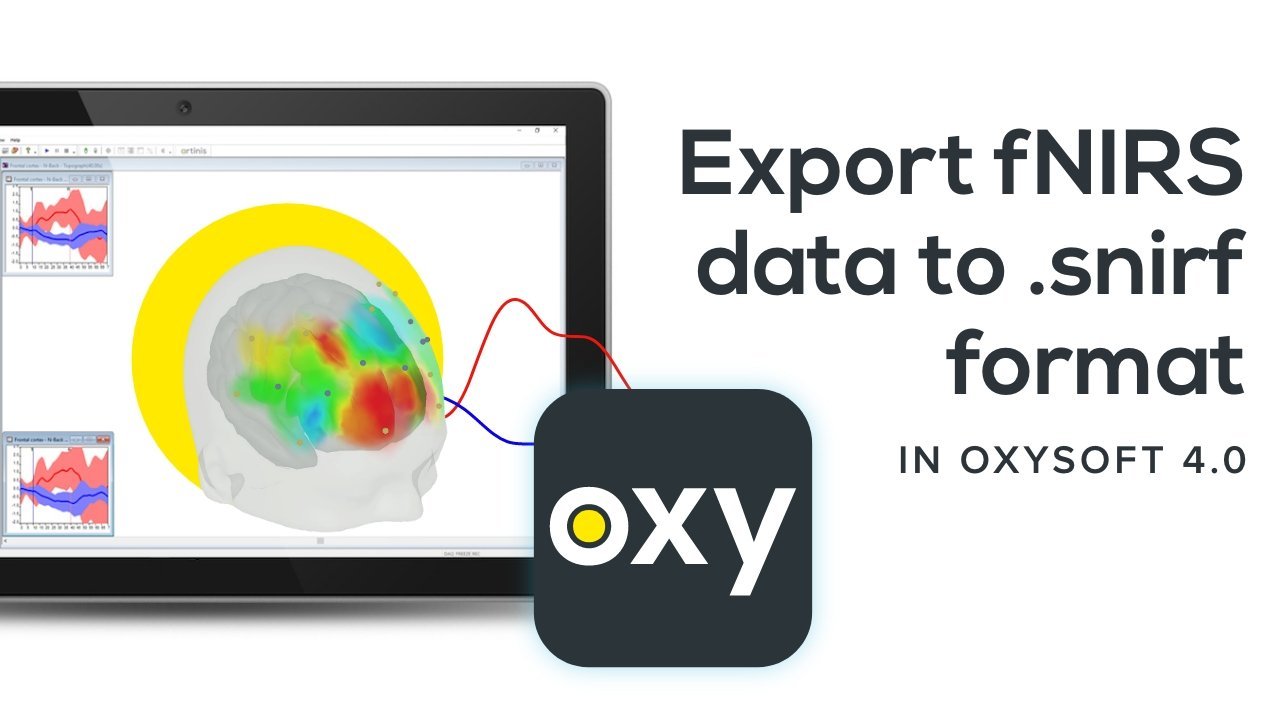
OxySoft 4.0 unlocks easy export of NIRS data to .snirf format
The shared near-infrared file format (.snirf) is a standardized data format that was developed by (f)NIRS researchers to facilitate the exchange and sharing of NIRS data. Read this blog post to learn more about the .snirf format and how to export your data directly to .snirf in our latest software OxySoft 4.0!
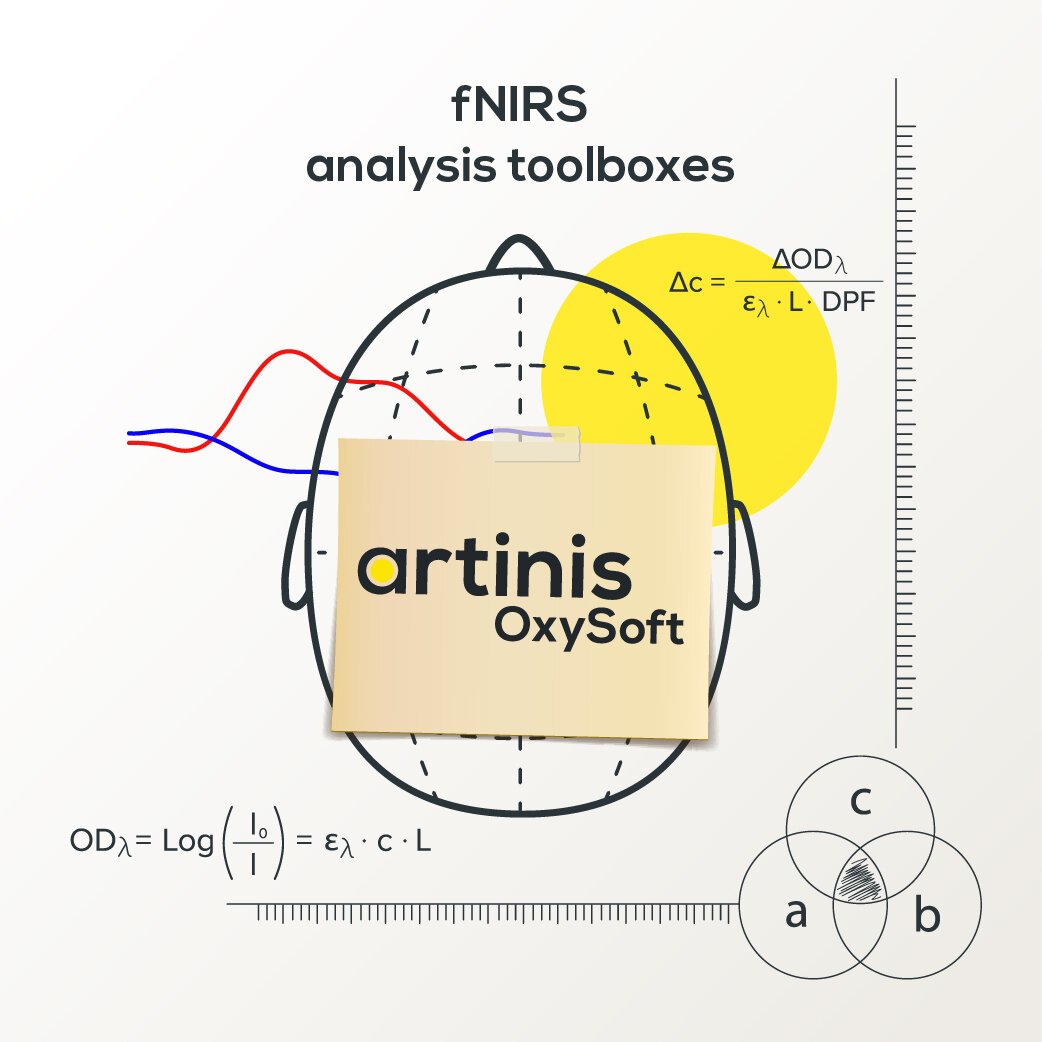
fNIRS analysis toolbox series – OxySoft
OxySoft is our proprietary, and dedicated, NIRS software used to collect, store, view, and analyze all necessary data. Here, we present the basic principle of data analysis within OxySoft itself and show a simple example of how to read in data, preprocess the data (filtering only), average over trials and over subjects and plot the final result in a graph. Finally, we will show how to get the data into a format suited for statistical analysis.
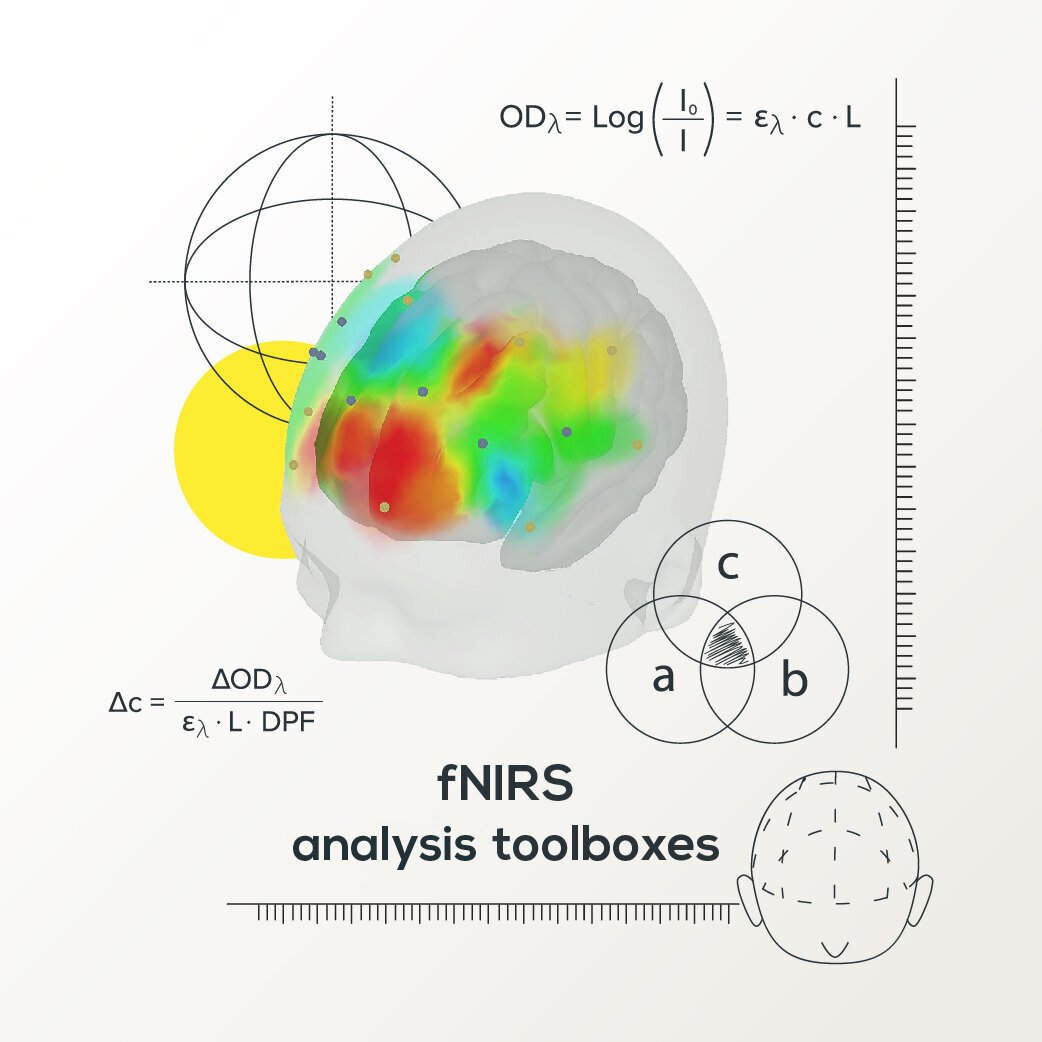
fNIRS analysis toolbox series – Introduction
In the coming months, we will highlight several toolboxes that are used by fNIRS researchers. A list of available toolboxes is compiled by the society for functional Near Infrared Spectroscopy. There are many toolboxes, each with its own strengths and specializations.

How to: Start a measurement and do a short analysis
If you don’t have time to read our extensive manuals, but would still like some quick pointers on how to start a measurement with one of our state of the art fNIRS devices… you’re in the right place! In this blog we will get you set-up in no time and discuss some of the analysis options our proprietary software, OxySoft, offers.
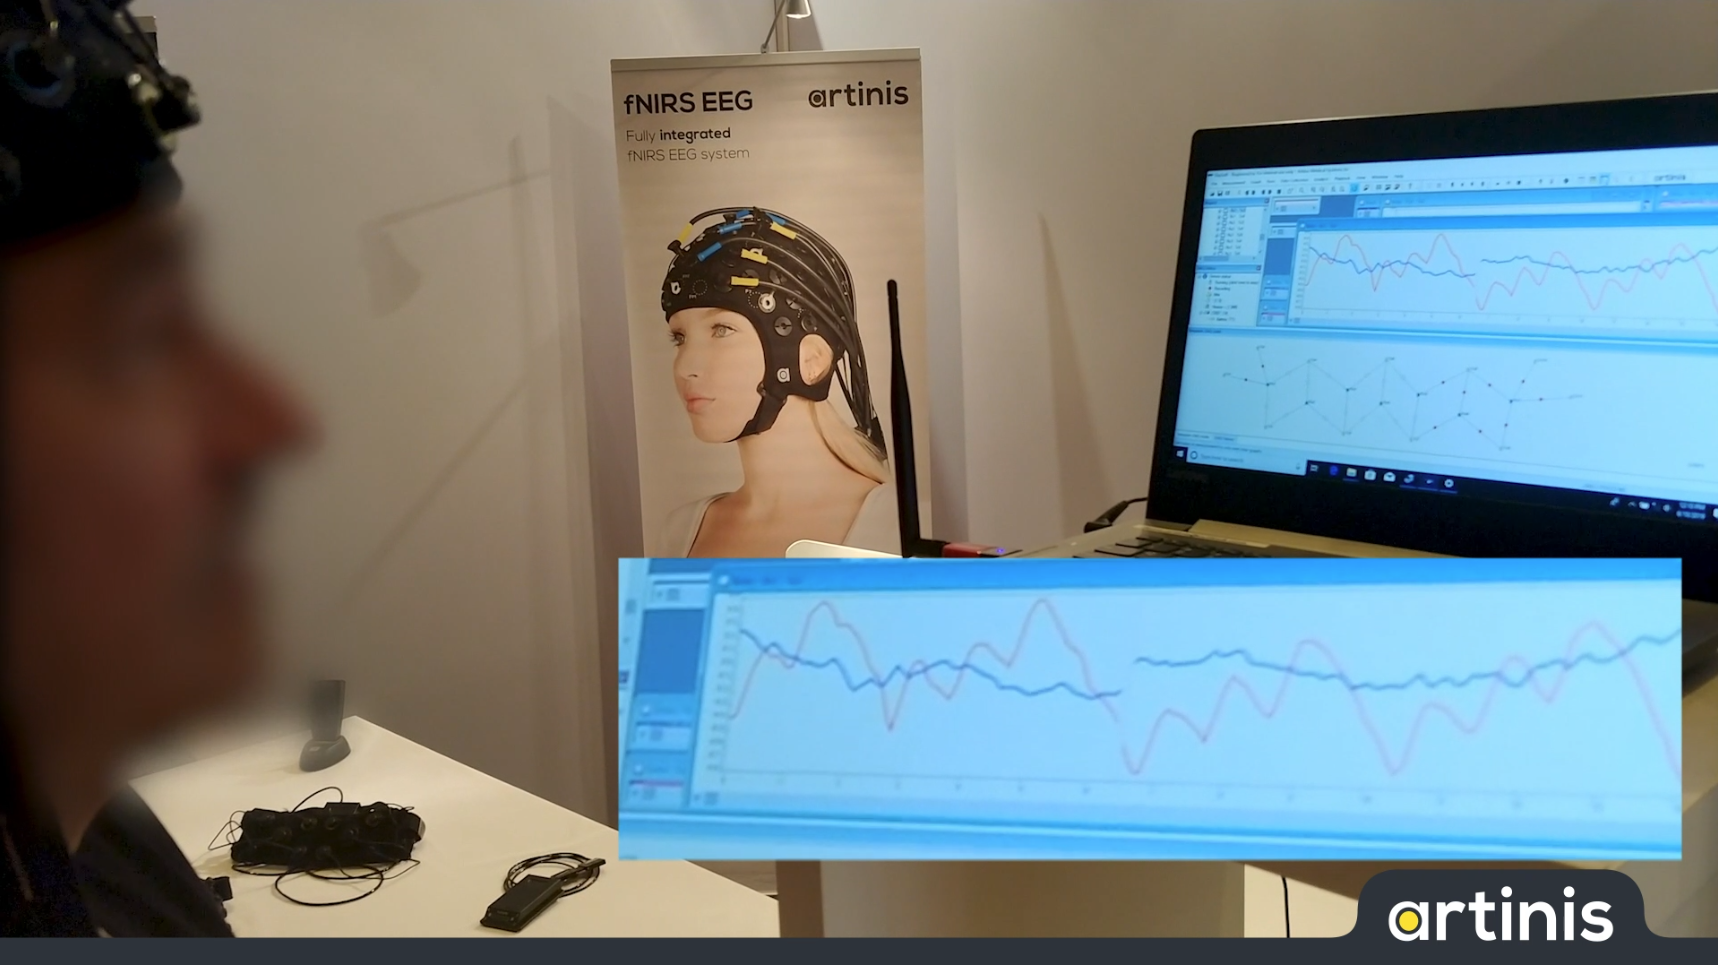
Artinis at the Organization for Human Brain Mapping
At the OHBM conference, we had multiple people with previous NIRS experience ask us if you could really get a good signal with a wearable device on adults. We offered them the chance to try it out themselves; a quick setup resulting in a good signal within minutes quickly dispelled their initial doubts. Seeing is believing!
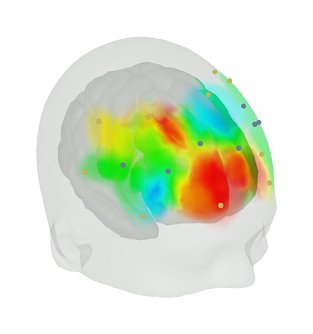
3D Digitization and Co-Registration to the MNI brain template using OxySoft
How do we know that the most active channels are located over the brain region of interest and not somewhere else? Of course, an experienced researcher just knows where to place the optodes, but is that enough to convince a potential highly-critical reviewer or fellow scientist?
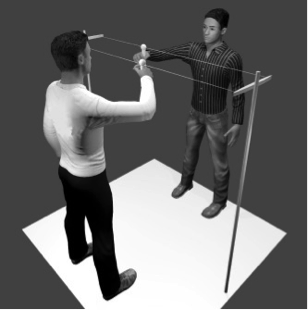
2fNIRS workshop: Hyperscanning with the OctaMon
Last week Artinis was present at the 2016 2f-NIRS conference in Montpellier, France. This two-day conference, titled NIRS signal: from acquisition to analysis, provided us with a great platform to give a mirror game workshop with two OctaMon devices.
