
In Artinis NIRS blog, you will find the latest trends in (f)NIRS, NIRS studies and applications, tutor from the leaders of near infrared spectroscopy, not to mention detailed insights and tips and tricks for your research!
Search blog post topic

Combining the world of NIRS and EEG
EEG and fNIRS are complementary measuring techniques. EEG measures electrophysiological brain activation, that is the electromagnetic field created when neurons in the brain are firing. fNIRS measures the hemodynamic response, that is the change of oxygen in the blood when a brain region becomes active. By combining EEG and fNIRS, a more complete picture of brain activity is obtained: activation of neurons and energy demand of neurons.
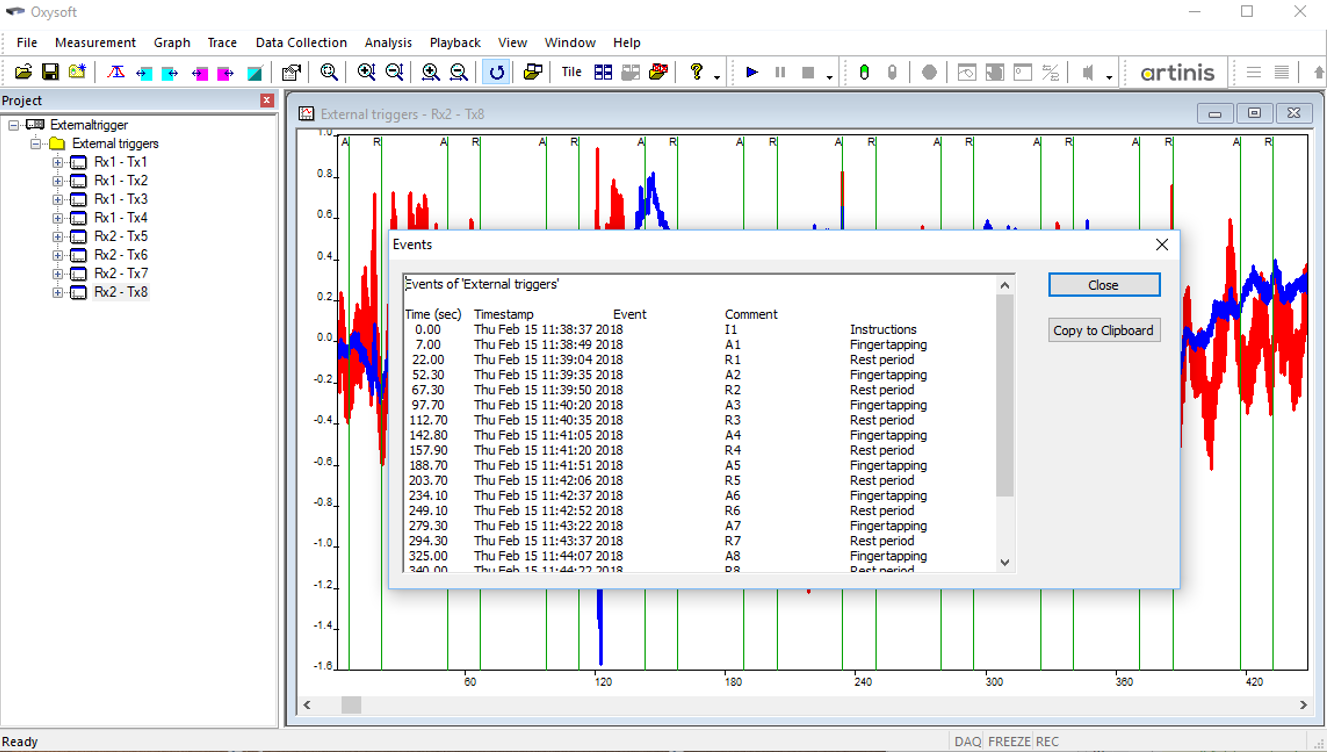
How are we synchronizing Artinis NIRS devices with other data streams?
Over the years we have developed both hardware-based and software-based options for data synchronization. In this blog we will explore the different options and discuss the advantages and disadvantages of each.

The do's and don'ts of baselines
A common question we get from our customers is what is a baseline and how to use it. Generally with fNIRS, the absolute values are arbitrary. The period before a stimulus is often referred to as the baseline. In this blog we will describe the do's and don'ts of baselines.
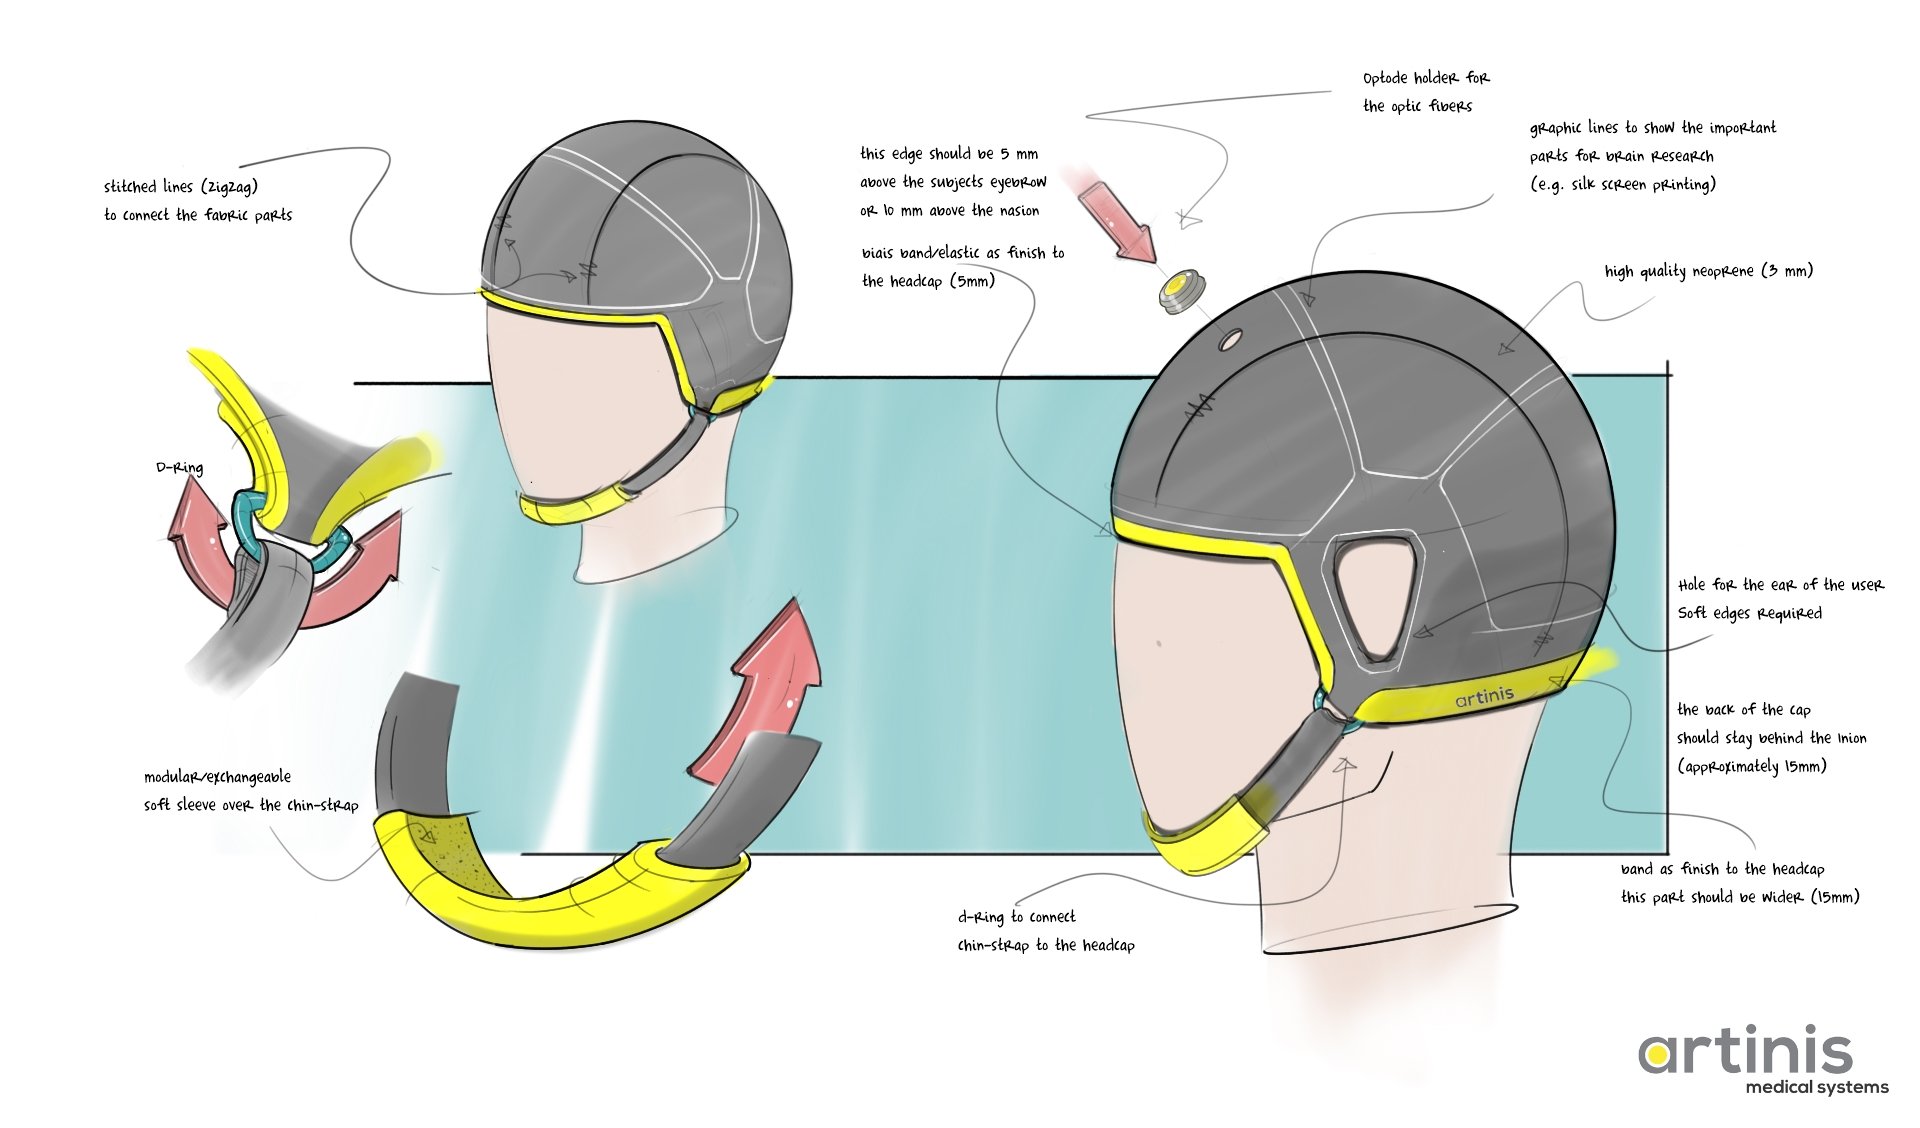
Just a ‘simple’ cap
An insight guide into NIRS head-cap development by our designer Wout Kregting

How to create the best optode template for your fNIRS setup
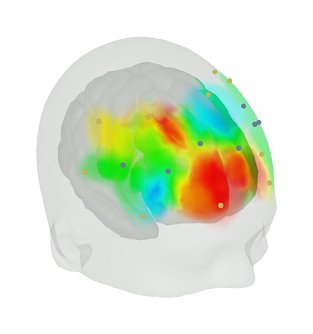
3D Digitization and Co-Registration to the MNI brain template using OxySoft
How do we know that the most active channels are located over the brain region of interest and not somewhere else? Of course, an experienced researcher just knows where to place the optodes, but is that enough to convince a potential highly-critical reviewer or fellow scientist?

User case: Combining multiple Artinis devices
Auditory cortex measurement with fNIRS.
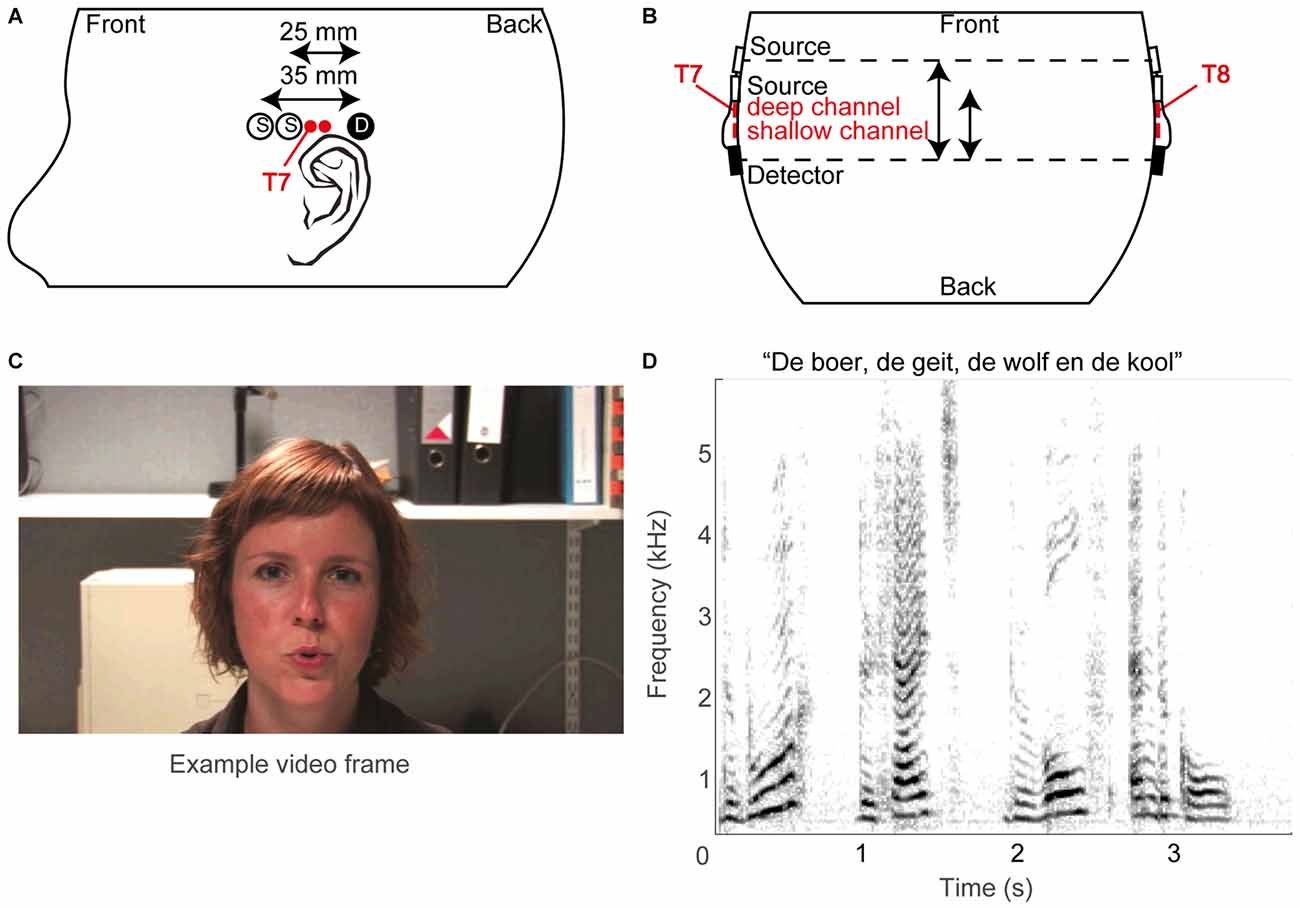
Auditory research with NIRS: an interview with dr. Marc van Wanrooij
Dr. Marc van Wanrooij and his team from the Hearing and Implants lab used a 48-channel OxyMon to study temporal cortical activation as represented by concentration changes of oxy- and deoxy-hemoglobin in 48, easy-to-apply optical fNIRS channels.