In Artinis NIRS blog, you will find the latest trends in (f)NIRS, NIRS studies and applications, tutor from the leaders of near infrared spectroscopy, not to mention detailed insights and tips and tricks for your research!
Search blog post topic

Using a customized Brite during diving - a blogpost interview with Triton Systems, Inc.
As it is portable, customizable and easy to use, fNIRS can be applied to measure brain activity in various and unusual applications. In this blogpost, we interview Triton Systems, Inc., who modified the Brite to make it waterproof and use it to get insights on brain oxygenation during deep water diving. They explain challenges they faced during modification, and give insights into first results of applying fNIRS during diving.
Publication overview 2024 - fNIRS studies with our devices
In 2024, an increasing number of relevant literature measuring brain activity with our fNIRS devices have been published. In this blogpost, we discuss application fields and purposes of using fNIRS to measure in the brain, and highlight exciting studies published in the last year with Artinis devices per category. Further, we show recent publications using our devices in naturalistic settings outside of the lab.
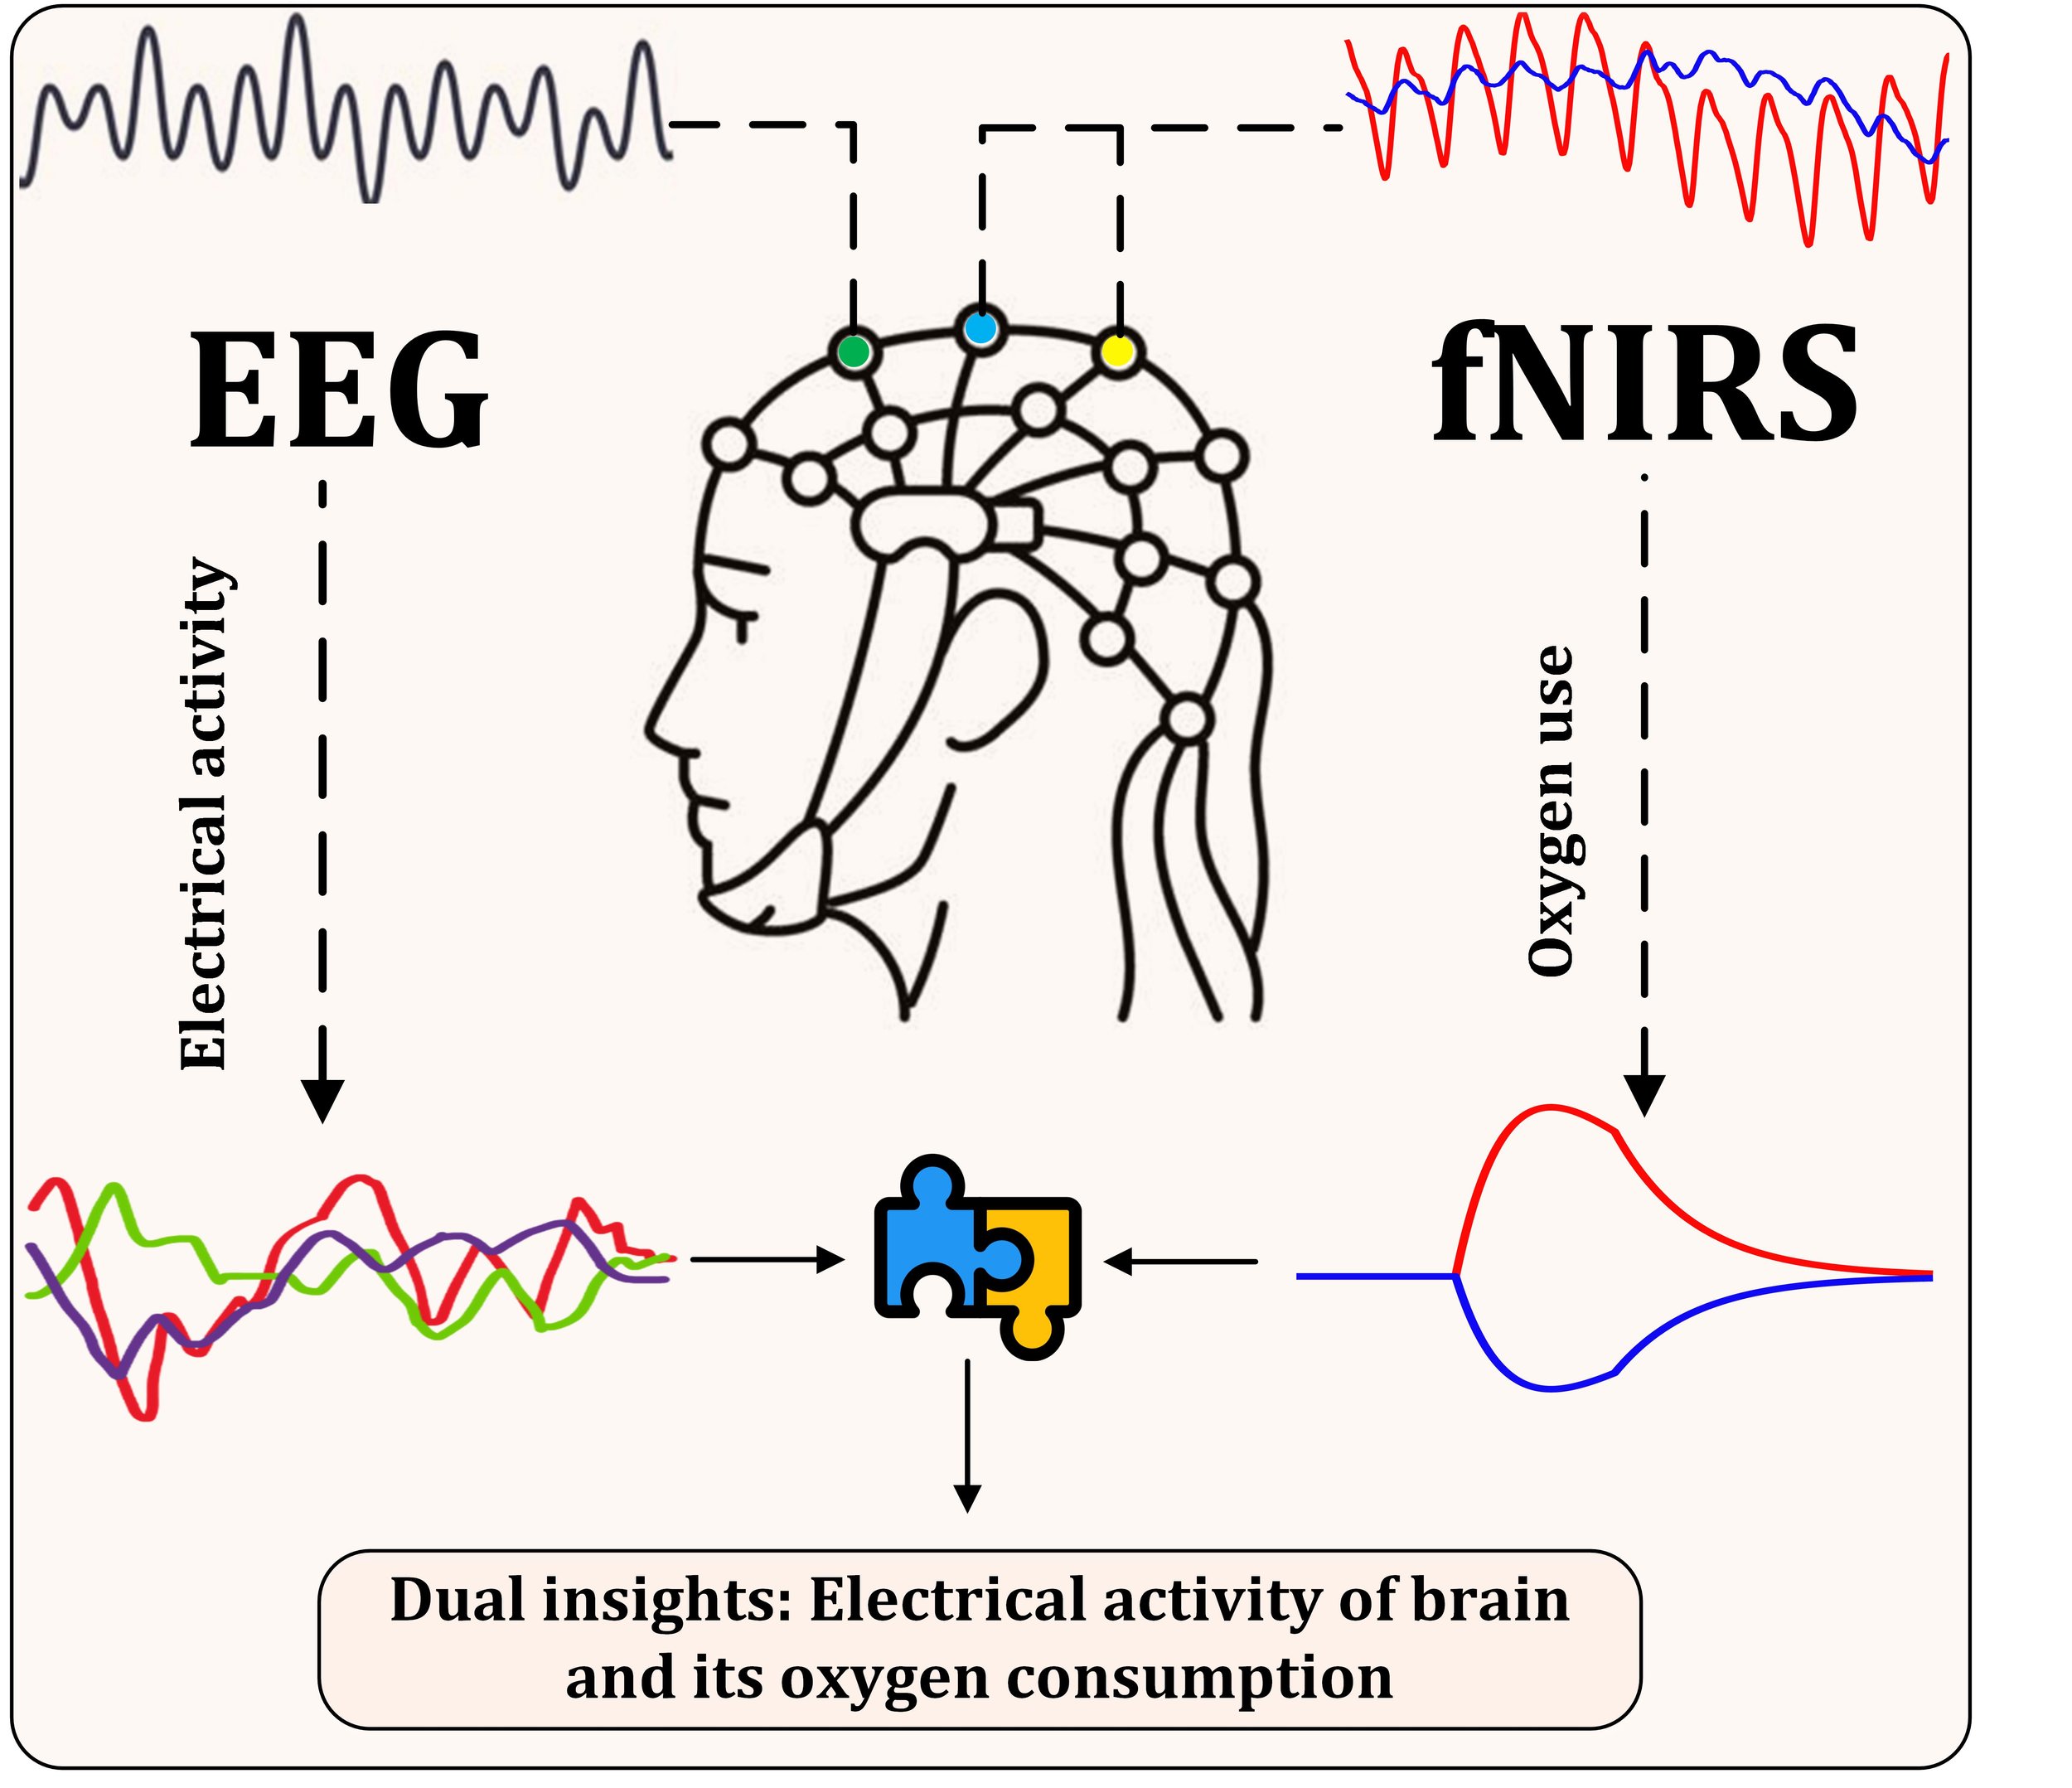
The Advantages of Combining fNIRS and EEG for Brain Monitoring
It is widely recognized that combining fNIRS and EEG can lead to a better understanding of brain activity by improving temporal and spatial resolution. However, the positive effects of simultaneously using both modalities go way beyond this advantage. In this blogpost, we highlight further benefits of applying the fNIRS-EEG combination to assess brain function in cognitive states.
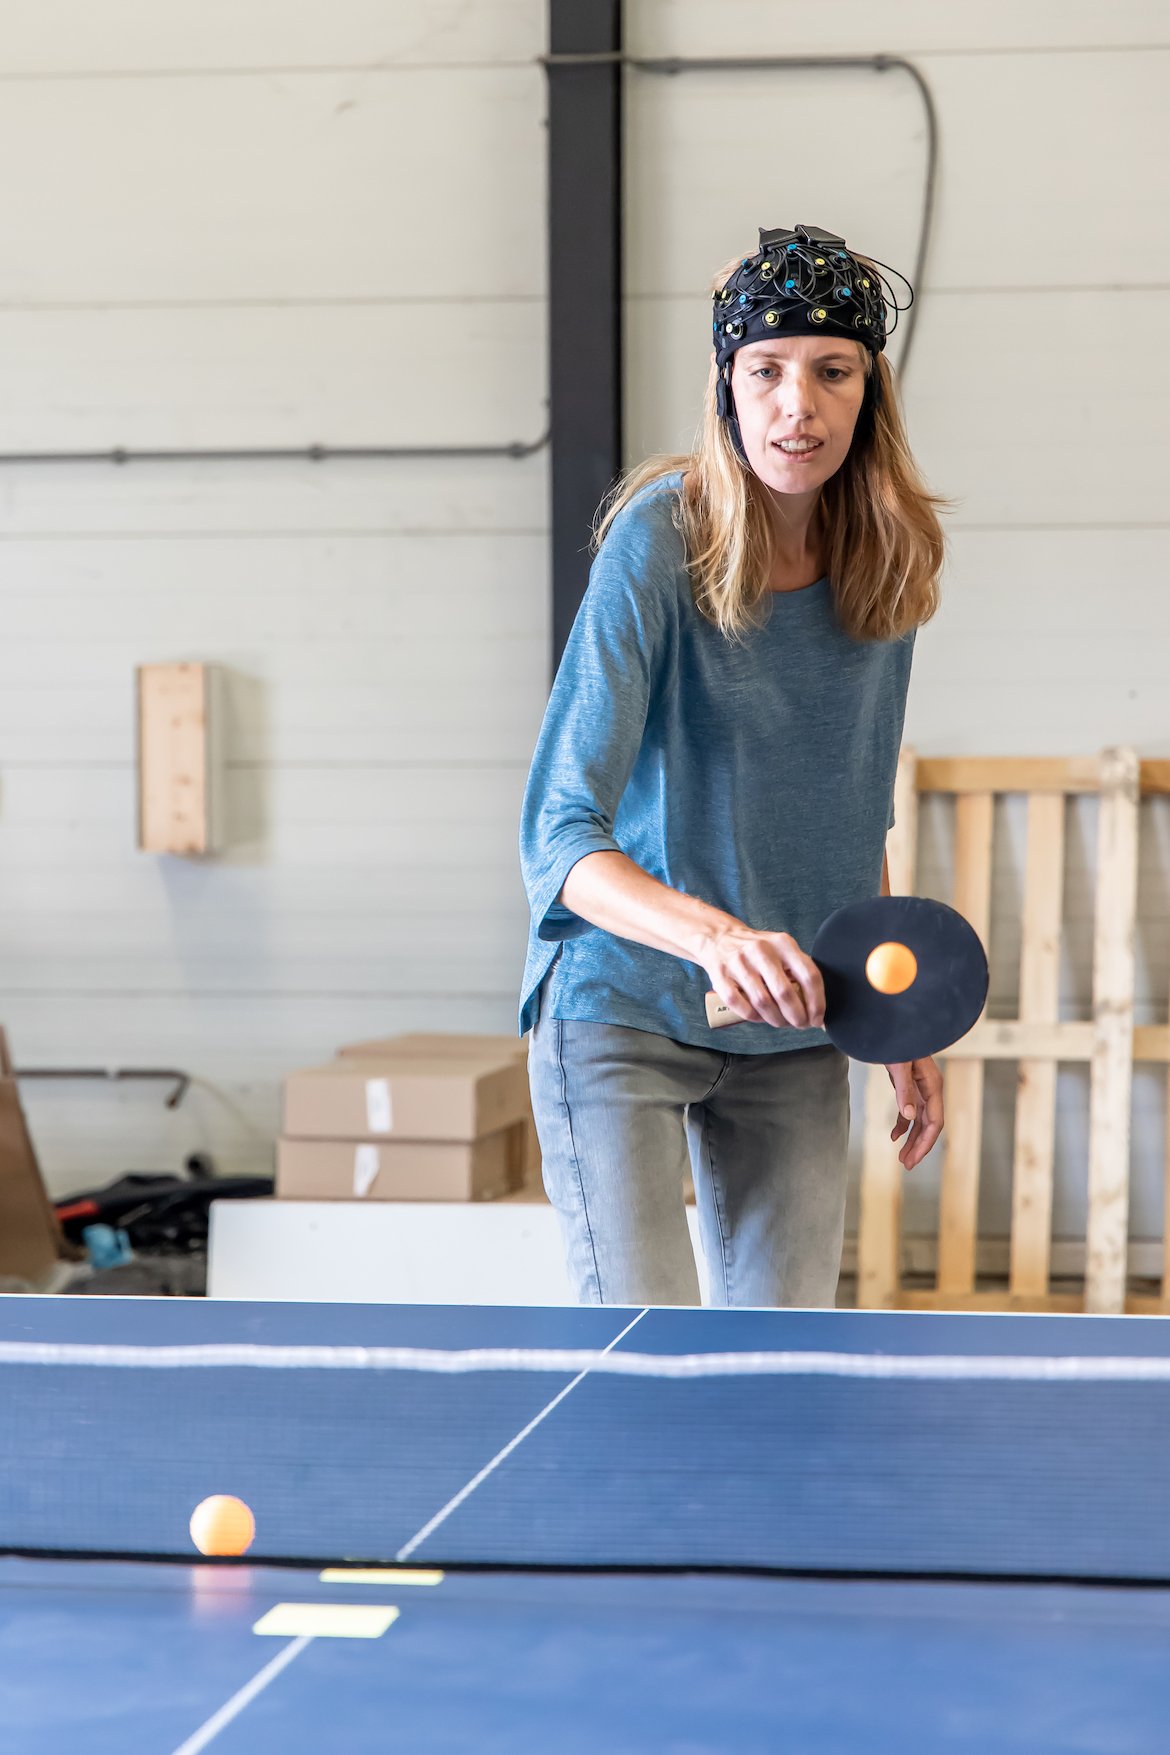
Moving in Sync: How Brains Connect During Collaborative Ping Pong - A fNIRS Study
fNIRS is a suitable tool to be used in out-of-the-lab experiments that involve movement, as it is portable and relatively insensitive to motion artifacts. In this mini-study we internally tested the usage of fNIRS during a collaborative hyperscanning experiment that involves movement with our Brite Frontal.
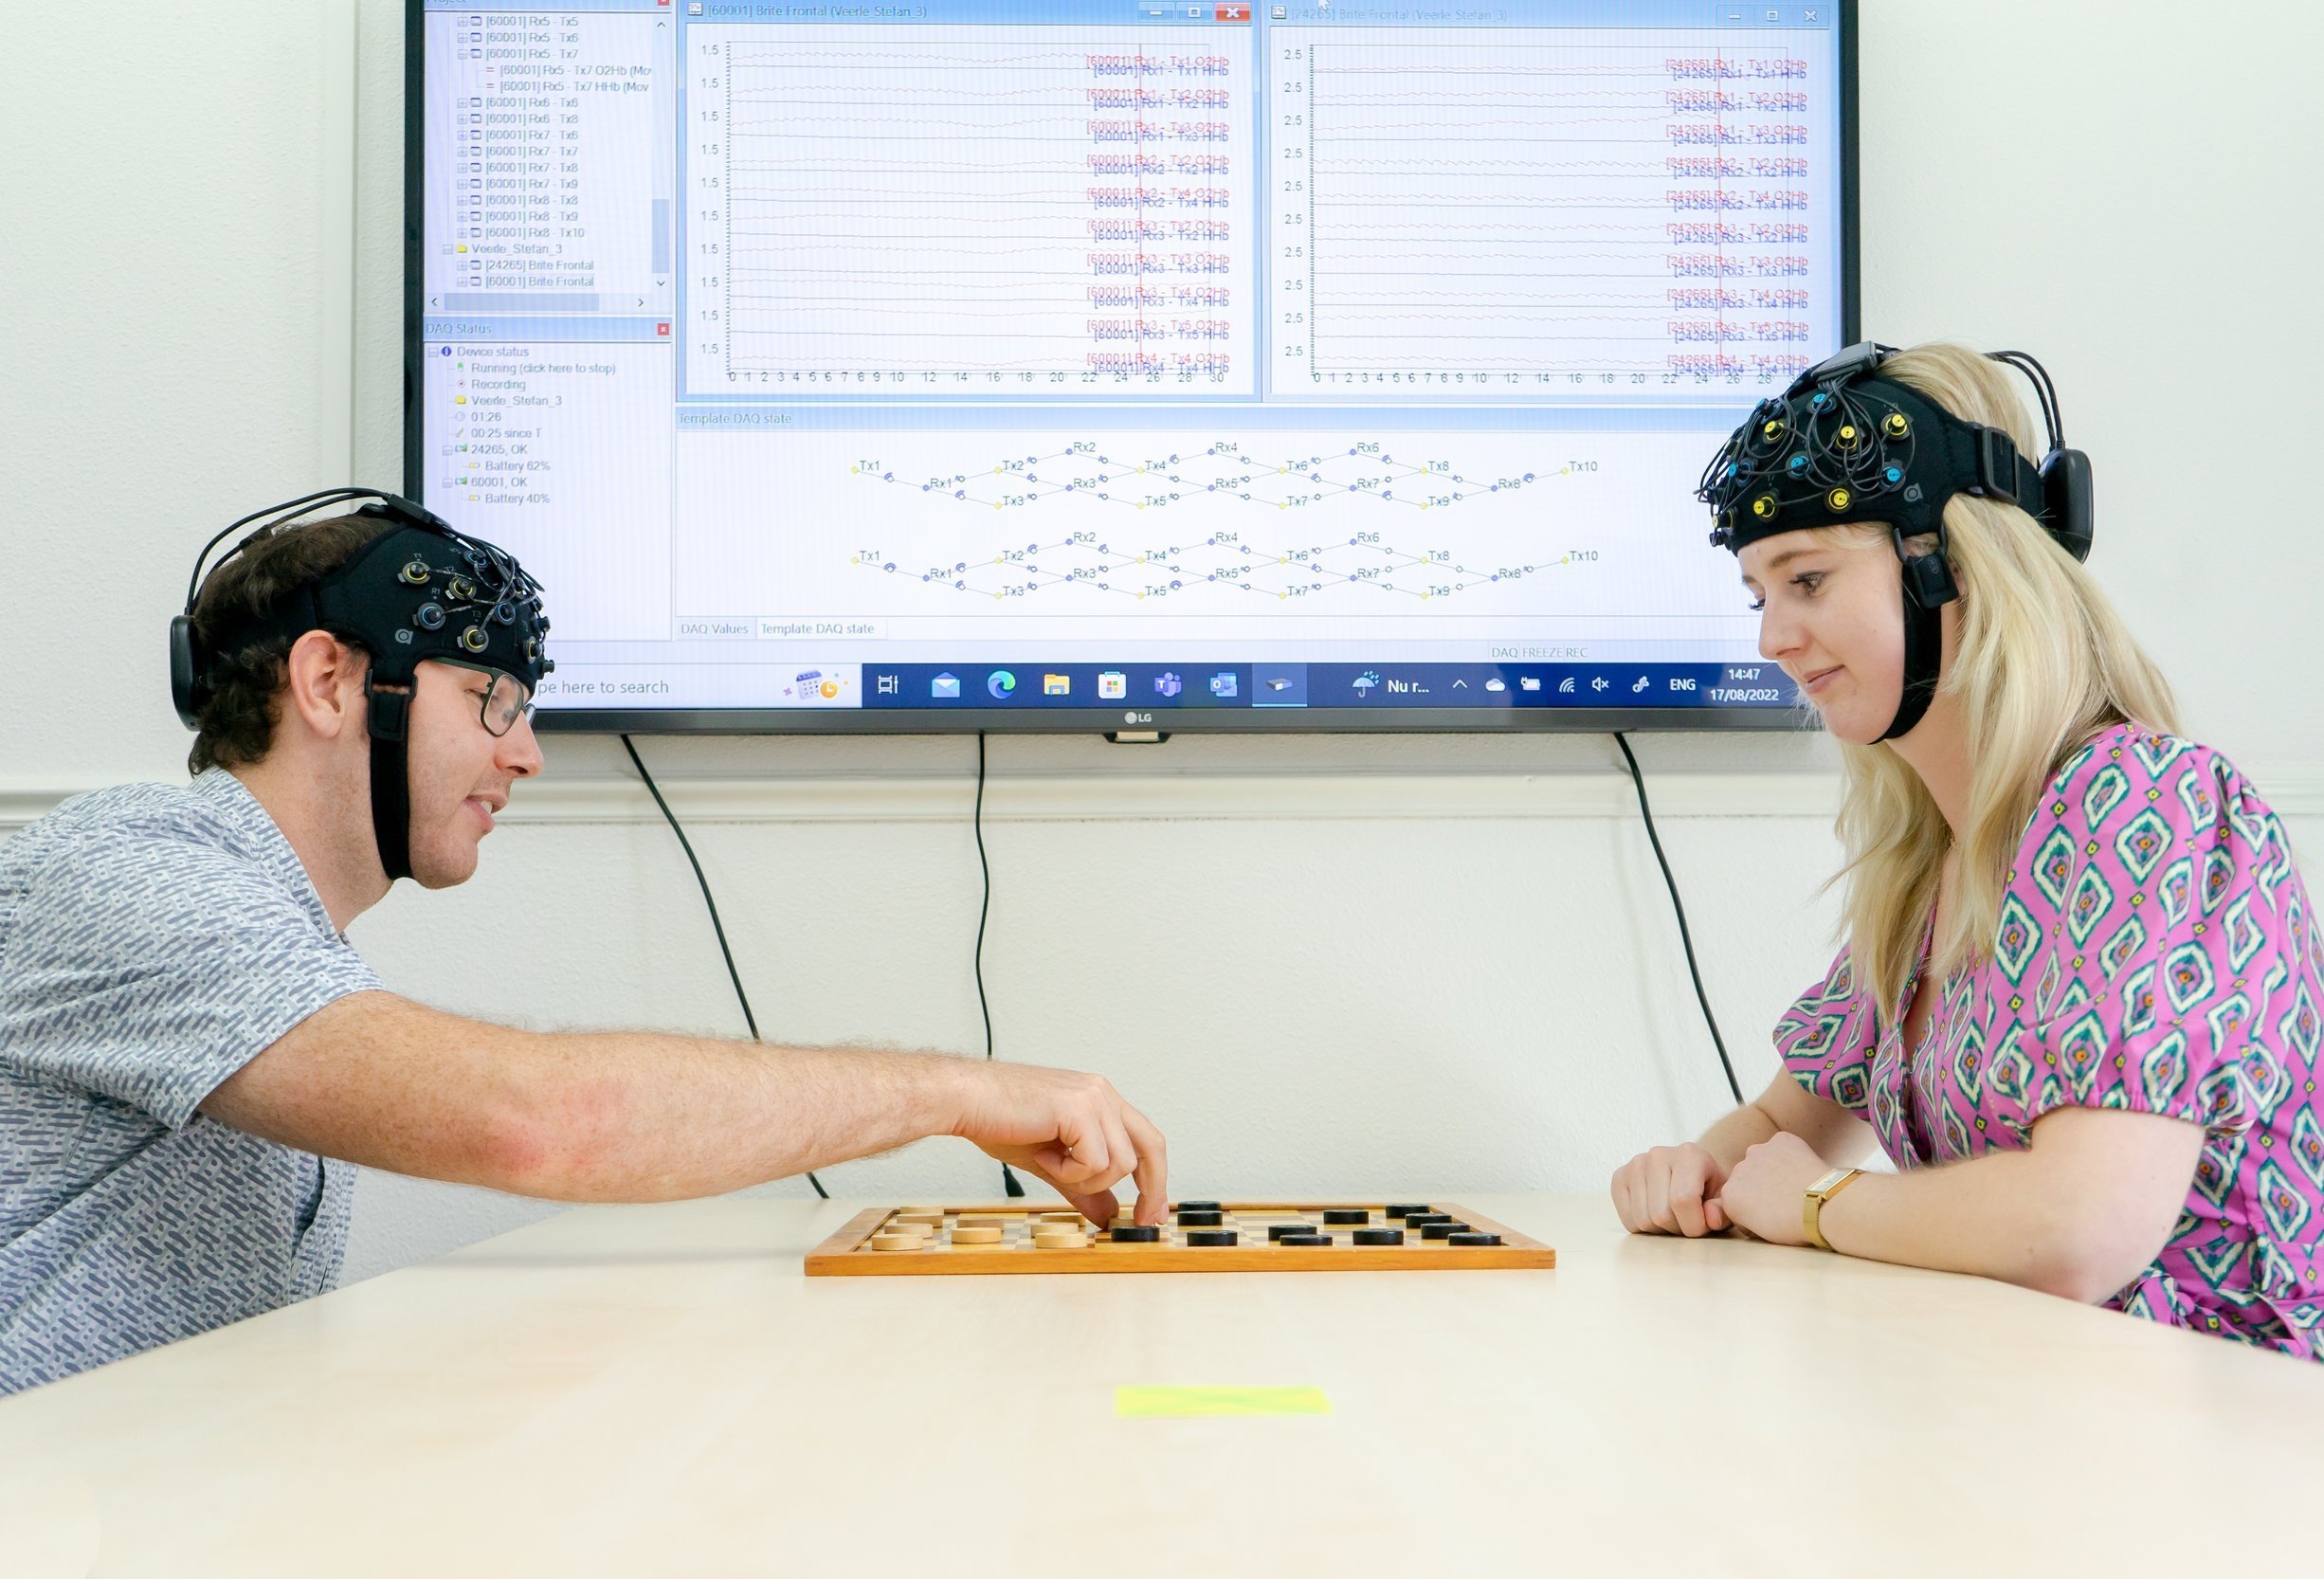
Measuring brain activity during playing a competitive checker game – a fNIRS hyperscanning mini study
In hyperscanning, brain activity and connectivity of multiple subjects are measured simultaneously during social interaction, for instance in competitive situations. fNIRS is often used as neuroimaging technology for hyperscanning in cognitive studies due to its portability and relative insensitivity to movement artifacts. In an internal mini-study, we tested the use of Brite Frontal to perform hyperscanning while participants played a competitive game of checker.
Integrating real-time fNIRS with biofeedback to promote fluency in people who stutter
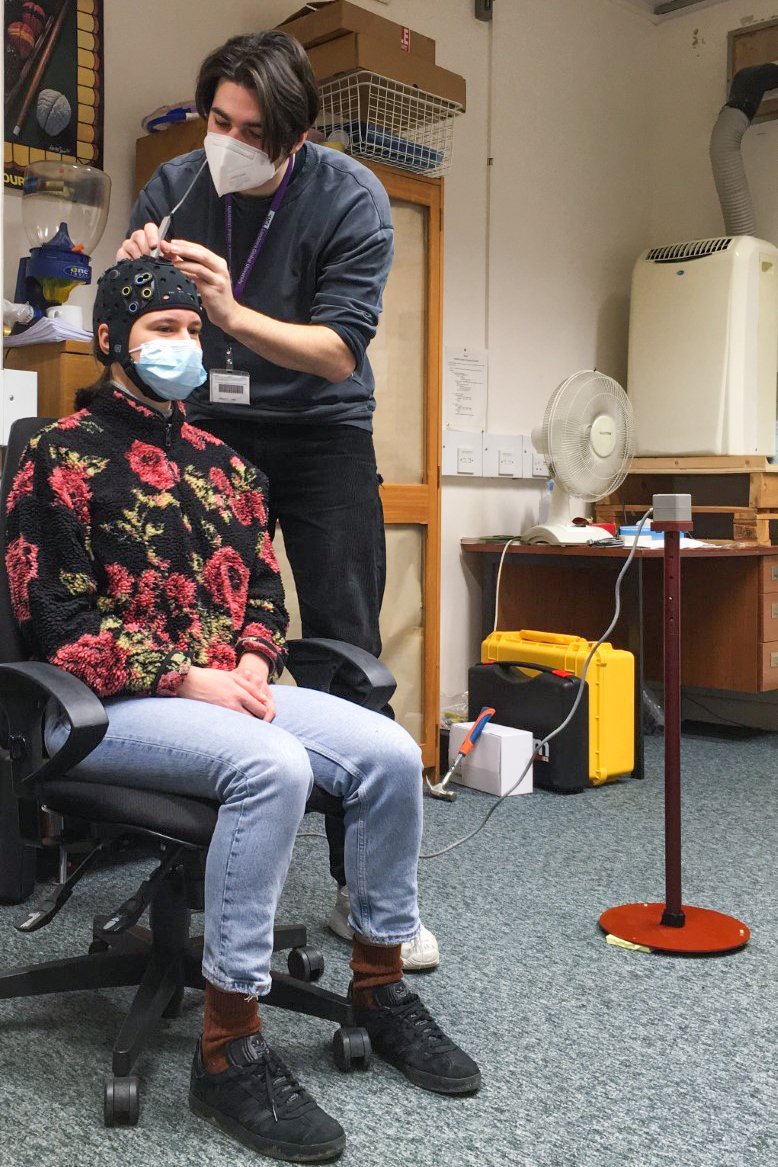
Over at the Speech Lab here in University College London, we are in the midst of data collection with the wearable fNIRS system, Brite. We’ve been investigating the hemodynamic biomarkers of stuttering along with cortical responses of altered feedback during speech.
fNIRS analysis toolbox series – MNE/Python
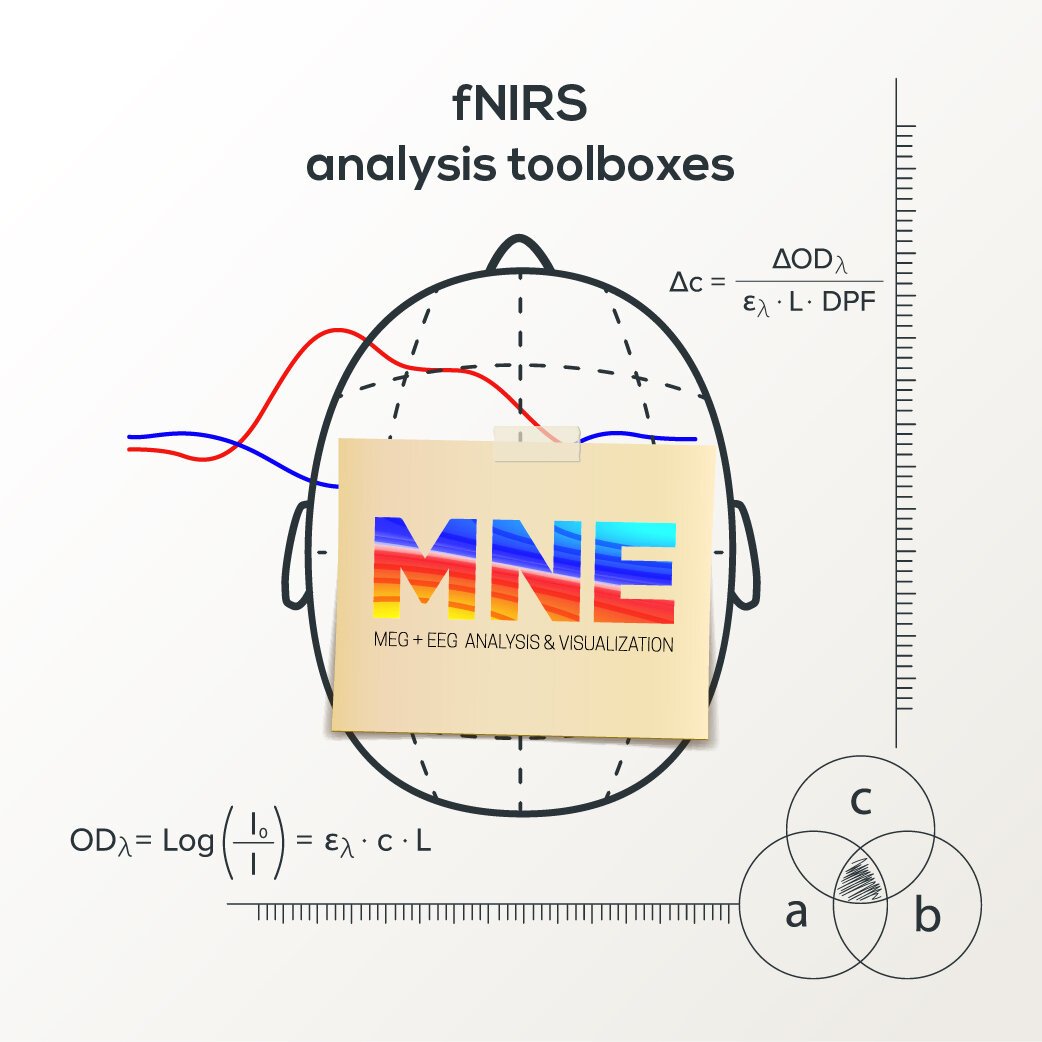
In this blog post, we present MNE-NIRS, a Python toolbox for analyzing NIRS/fNIRS data, which aims at researchers with a background in engineering, neuroscience and/or AI. The toolbox is handled by scripting the processing pipeline, which can be done in a regular Python script or within a Jupyter notebook.
Exploring the infant brain with fNIRS
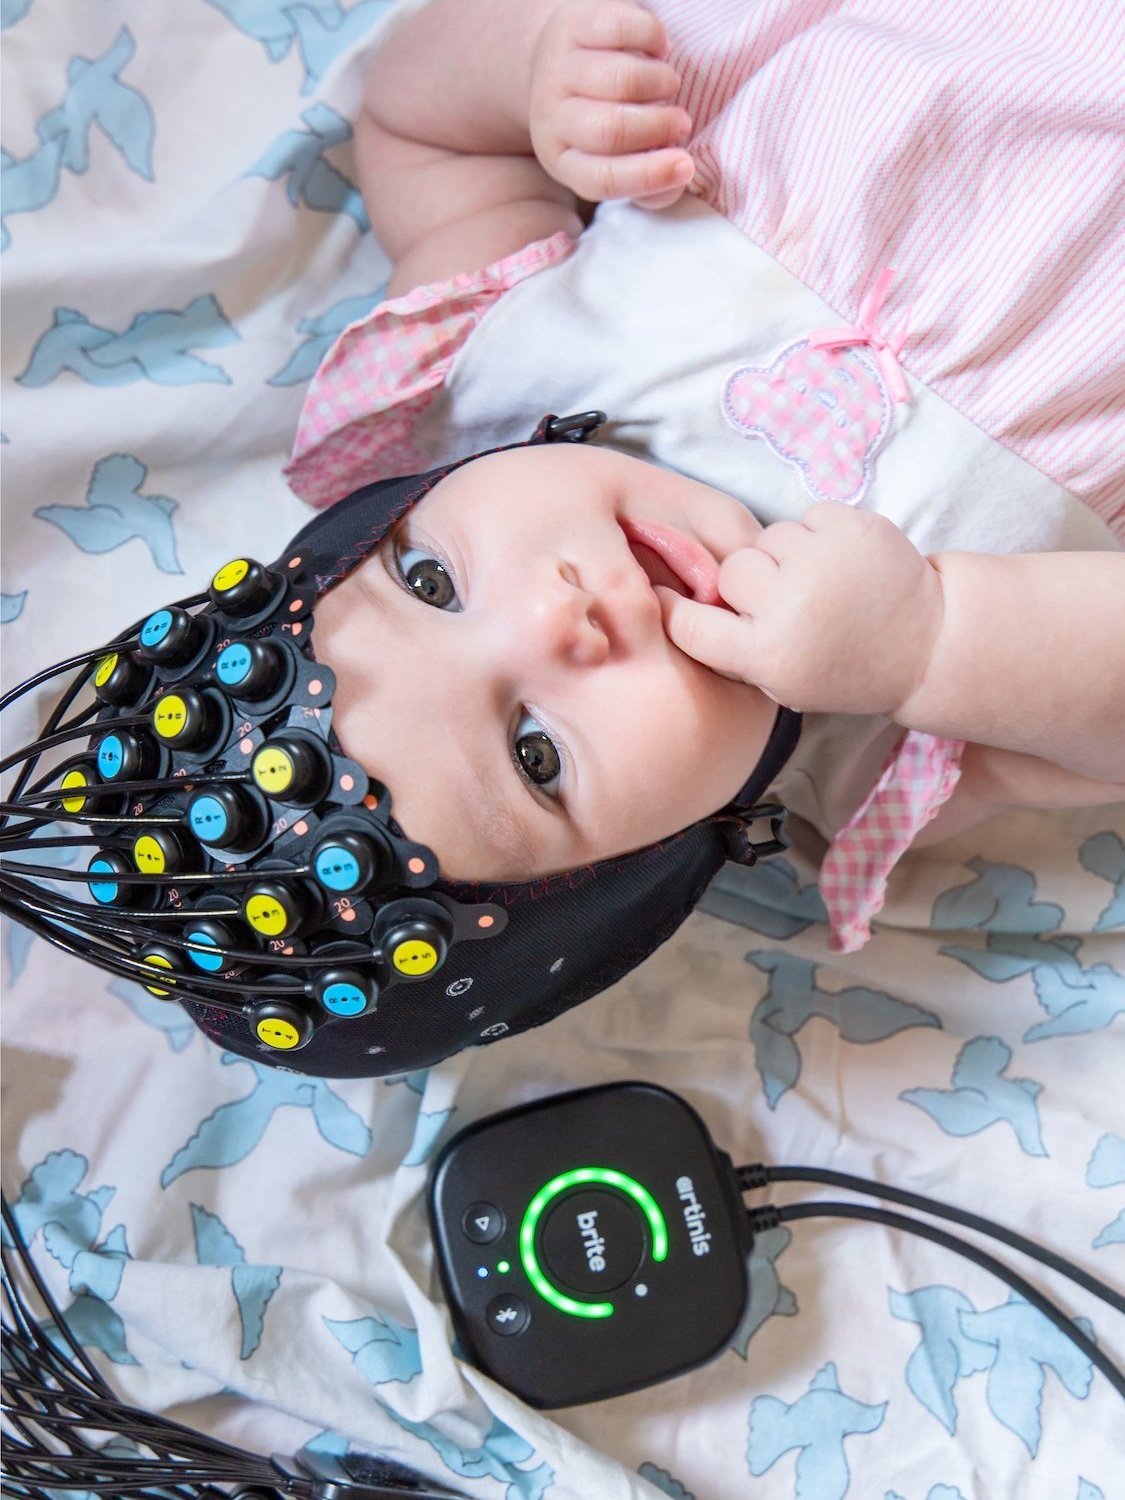
Testing young babies, between 0 and 2 years of age, is definitely fun, but it also comes with challenges. We asked several developmental researchers to point out the main difficulties they typically encounter and what features an infant-friendly NIRS should have. So, what are these challenges and what can researchers and technology do to overcome them?
fNIRS analysis toolbox series – Homer
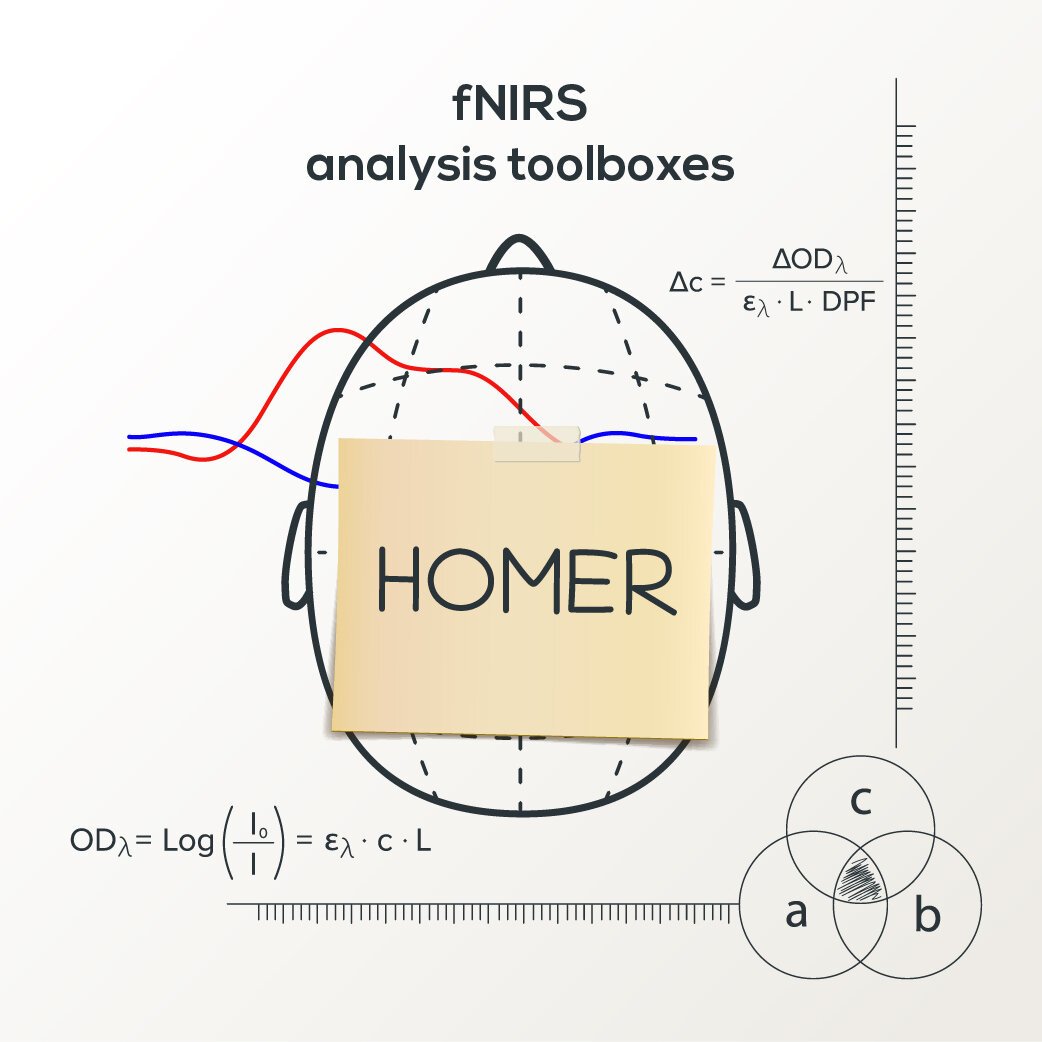
Here we present Homer3, an open-source MATLAB toolbox for analysis of fNIRS data and for creating maps of brain activation. In this blog post, we present the basic principle of Homer3 and show a simple example of how to read in data, preprocess the data (filtering only), average over trials as well as over subjects, and plot the final result in a graph.
fNIRS analysis toolbox series – FieldTrip
Here we present FieldTrip, which is a MATLAB analysis toolbox that was originally designed for electrophysiological data analysis. However, FieldTrip supports fNIRS data analysis as well. It contains high-level functions that can be combined in a MATLAB script. It aims at researchers with a background in neuroscience, engineering, optics and physics.
fNIRS analysis toolbox series – Brain AnalyzIR
Here we present the NIRS Brain AnalyzIR toolbox, a toolbox for analysis of (f)NIRS data in Matlab. NIRS Brain AnalyzIR toolbox aims at researchers with a background in neuroscience. The toolbox is suitable for researchers having basic knowledge of Matlab and especially those who are comfortable with object-oriented programming.
fNIRS analysis toolbox series – NIRSTORM
Here we present NIRSTORM, a NIRS analysis plugin for the MATLAB-based MEEG Brainstorm toolbox. It is aimed at researchers with a background in neuroscience, engineering, optics and physics. Here, we present the basic principle of NIRSTORM and show a simple example of how to go from raw data to a visualisation of the average response over trials and sessions.
